


Better handling, lower fuel consumption: What are the benefits of a 10-point improvement?
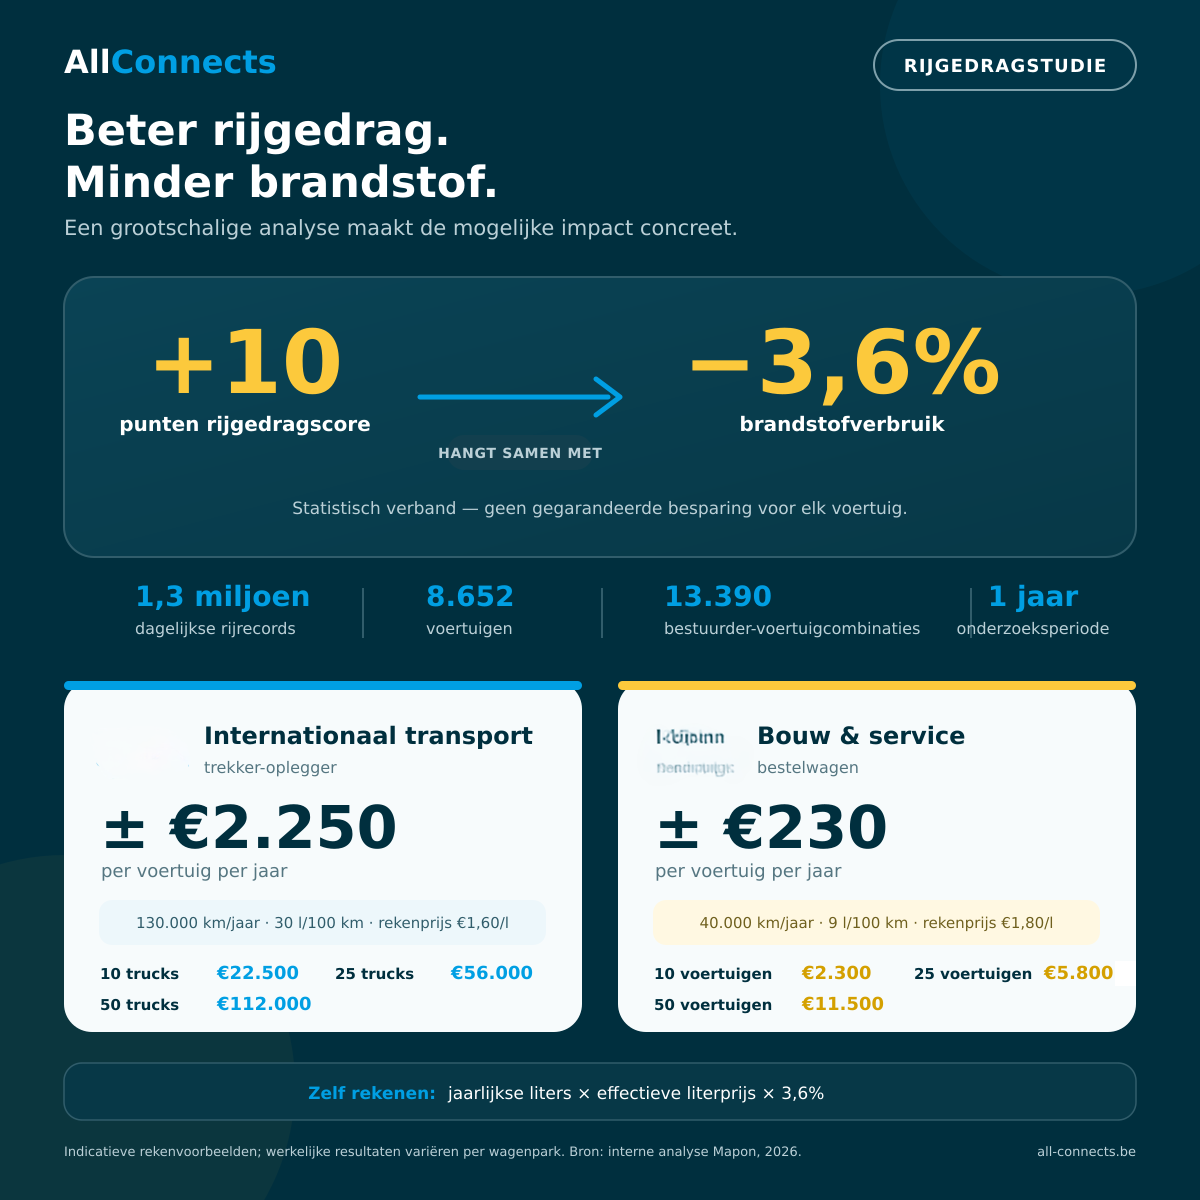
A 10-point improvement in the driving behavior score corresponds to approximately a 3.6% reduction in fuel consumption. That may sound modest—until you do the math for your own fleet.
For many fleets, fuel is the largest variable cost. Furthermore, the link between driving behavior and fuel consumption is stronger than most fleet managers realize.
How reliable is that figure?
This is a statistical correlation, not a guarantee. Vehicles with a higher driving behavior score consume less fuel on average—which is different from the promise that every driver who improves their score by 10 points will automatically save 3.6%. What does make the analysis robust, however, is its scope and design.
In addition, adjustments were made for vehicle weight and outside temperature —two factors that significantly influence fuel consumption. As a result, the measured effect can largely be attributed to driving behavior itself, rather than to external conditions. The correlation also held true across all hardware families used.
That is considerably more substantiation than most cost-saving claims in this sector.
What does 3.6% mean for your fleet?
Before you read on: here's the formula you can use to check the calculation yourself right away.
Check it with your own numbers:
jaarkilometers × verbruik per 100 km ÷ 100 × effectieve literprijs × 3,6%
Below, we apply them to the two fleet profiles we see most often.
Profile 1: International Transportation
A tractor-trailer in international traffic travels about 120,000 km per year at a fuel consumption rate of 35 l/100 km. That amounts to approximately 42,000 liters.
For this illustrative example, we’ll use an effective fuel cost of €1.60 per liter. This can vary significantly from one carrier to another depending on refueling countries, contract prices, discounts, and tax rebates. At that price, your fuel costs will total approximately €67,000 per year, and a 3.6% return will yield approximately €2,400 per vehicle per year.
If you use an effective price around the European average of €1.85 per liter, you end up with about €2,800 per truck per year—the figure from the original study.
| Fleet | Estimated annual savings (at €1.60/liter) |
|---|---|
| 10 trucks | ± €24,000 |
| 25 trucks | ± €60,000 |
| 50 trucks | ± €120,000 |
Profile 2: Delivery Vans in Construction and Service
A delivery van that covers a lot of domestic mileage travels about 40,000 km per year at 9 l/100 km, which amounts to approximately 3,600 liters.
For this illustrative example, we’ll use €1.80 per liter, excluding VAT. Feel free to substitute your own average net fuel cost. At that price, your fuel costs about €6,500 per year, and 3.6% of that amounts to about €230 per vehicle per year.
| Fleet | Estimated annual savings |
|---|---|
| 10 delivery vans | ± €2,300 |
| 25 delivery vans | ± €5,800 |
| 50 delivery vans | ± €11,500 |
Per delivery van, that might not seem like much. But the amount comes back year after year, without any investment in new equipment. And with light-duty vehicles, fuel is only part of the business case.
Curious to find out what savings are possible in your fleet?
During a demo, we’ll work together to see what driving behavior data is currently available for your fleet and where the greatest potential for improvement lies. No obligation and no sales pitch.
Schedule your demoMore Than Just Fuel
The habits that cost you extra liters also cost you money in other ways. A more relaxed driving style means:
- Fewer damages and fewer accidents —a major expense for many fleets, compounded by downtime and replacement vehicles
- less wear on tires, brakes, and the clutch
- a more favorable claims history, which may also be relevant in discussions with your insurer
- lower CO₂ emissions, which are increasingly being required in solicitations and sustainability reporting
Where does that improvement in fuel economy come from?
Not from spectacular maneuvers. But from everyday habits behind the wheel:
- accelerating more smoothly instead of sprinting toward the next red light
- Reduce idling —an engine that’s running while the vehicle is stationary consumes fuel without covering a single kilometer
- maintain a more consistent speed, especially on the highway
- Anticipate what's happening further down the road so you don't have to brake as hard
The principles are not new. The difference lies in the extent to which they are objectively measured and monitored.
Monitoring and Coaching Driving Behavior
With FLEET.PRO, depending on the configuration you choose, you can analyze driving behavior by vehicle and by driver:
- driving performance reports covering sudden braking, rapid acceleration, sharp turns, speed, and fuel consumption
- Driver registration for each trip via a badge system, so that behavior is linked to the correct person and not to the vehicle
- CAN bus connection for consumption data directly from the vehicle, rather than estimates
- Configurable Alarms for Abnormal Behavior
This shifts the conversation from "I think you're driving too fast" to "here are your numbers from last month, and this is how they're trending."
Five Steps to a Better Score
First, measure; then be quiet for a moment
Collect data for one to two months before you do anything with it. Without a baseline measurement, you won't know later whether you're making progress.
Select two or three criteria
Abrupt braking, hard acceleration, and idling are enough to get started. Trying to do everything at once doesn't work.
Start with personal feedback
A public ranking can be motivating, but only if it aligns with the company culture and drivers perceive the comparison as fair.
Discuss it briefly and regularly
Five minutes per month per driver is more effective than one long session per year.
Reward progress, not perfection
The driver who goes from 62 to 74 yields more than the one who was already at 88.
Important: Approach this as coaching, not as monitoring. When driving behavior data is used primarily to penalize drivers, it undermines trust and support—and in the long run, that will cost you more than the fuel savings you achieve.
Frequently Asked Questions
No. This is a statistical correlation based on thousands of vehicles; it’s not a guarantee for each driver. The actual result depends on the vehicle type, trip profile, load, and your starting score. Those who start with a low score usually benefit the most.
The mechanism is the same, but the amounts are lower because fuel consumption and mileage are lower. For delivery vans, a large portion of the savings comes from fewer repairs, less downtime, and less wear and tear—not just at the pump.
Based on parameters such as sudden braking, rapid acceleration, sharp turns, idling, speed, and RPM. Each parameter is assigned a weight, and together they form a single score for each driver or vehicle. This allows you to see at a glance who is making progress and where coaching will be most effective.
Yes, provided you handle it correctly. You need a legitimate purpose (such as cost control and traffic safety), you must clearly inform your drivers in advance about what you are measuring and why, and you should not collect more data than necessary. Include this in your employment regulations or a policy, and consult with the union representatives where applicable.
That is the most important factor for success. Explain in advance what you’re measuring, why, and what will and won’t be done with the data. Use the numbers to coach and reward progress, not to punish. Fleets that do the opposite will quickly see support dwindle.
Source: internal analysis by our international technology partner (2026), based on 8,652 vehicles, 13,390 driver-vehicle combinations, and approximately 1.3 million daily driving records over the course of one year, adjusted for vehicle weight and outside temperature. This represents a statistical correlation; actual results vary depending on factors such as vehicle type, driving profile, load, and baseline score. The savings figures in this article are indicative calculation examples based on the listed odometer readings, fuel consumption, and actual per-liter prices.

Hilde Lavrijssen - Marketing Manager at AllConnects
Closely follows the digitization of fleet and equipment management in the construction industry and translates it into practical insights for companies on the road and at construction sites.
